US clean energy use increased in 2016, according to National Lab report
Americans used more clean energy in 2016 than the previous year, while energy consumption remained close to flat, according to energy flow charts released this week by Lawrence Livermore National Laboratory.
The United States consumed approximately 97.3 quadrillion British Thermal Units (quads) in 2016, an increase of 0.1 quads from 2015.
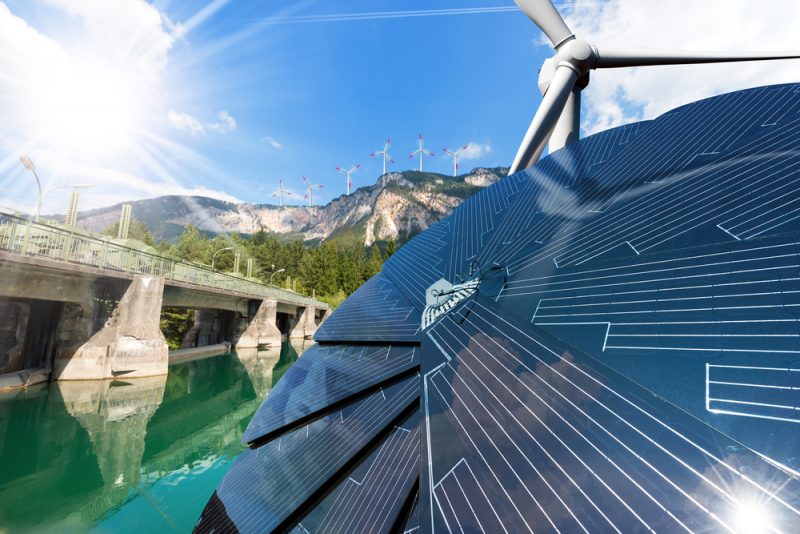
Solar energy use rose by 0.15 quads or 38 percent in the electricity, commercial and residential sectors.
“Two thirds of that increase was in the electric sector,” A.J. Simon, group leader for LLNL’s energy program, said. “These are large installations of thousands of solar panels, usually in the desert.”
Americans used 0.33 more quads or 19 percent more wind power in 2016.
“Generous incentives for renewable energy, combined with improved ‘know-how’ in siting and building wind farms, has led to a favorable environment for growth in this sector,” Simon said.
Natural gas use rose by 28.5 quads or 1 percent.
The use of coal declined by 14.2 quads or nine percent mainly due to decreased coal supply to the electricity sector. Wind, solar and natural gas replaced that supply.
In the residential, commercial and industrial sectors energy consumption decreased slightly, while the usage of fossil fuels rose by 0.5 quads or 2 percent in the transportation sector.
The U.S. Energy Information Administration recently changed the way it analyzes and reports renewable energy use, a change that is reflected in the flow chart. The chart also incorporates a change by the Department of Energy’s Advanced Manufacturing Office in the estimate of efficiency of the industrial sector from 80 percent to 49 percent.